It is the last day of SigNoz Launch Week 2.0, and we’re excited to announce improvements in the logs module of SigNoz. Searching and filtering for logs to debug issues is one of the top critical workflows any developer uses.
We have gathered feedback from our users and shipped some important features that focus on speeding up log searches, refining the filtering process, and enhancing the overall log analysis experience.
Why Logs Matter
Logs are a fundamental aspect of observability. They’re often the first point of reference when troubleshooting issues, whether they’re frontend bugs, backend errors, or infrastructure problems.
However, due to their sheer volume, logs can be overwhelming, and searching for relevant logs can be time-consuming. This is why improving the search and consumption of logs has been our key focus.
Areas of Focus
When we began working on these enhancements, our goal was twofold:
- Simplify Log Searching: Making it easy for users to search for the logs they need during critical incidents quickly.
- Improve Log Consumption: Enhancing the readability and interpretation of logs once they’ve been identified.
With these two goals in mind, we shipped improvement to the Logs explorer in SigNoz.
Key Improvements: Streamlined Log Searching
Here’s a quick demo of the key improvements that we shipped:
https://www.youtube.com/watch?v=n9Kq_l4EeCwQuick Filters
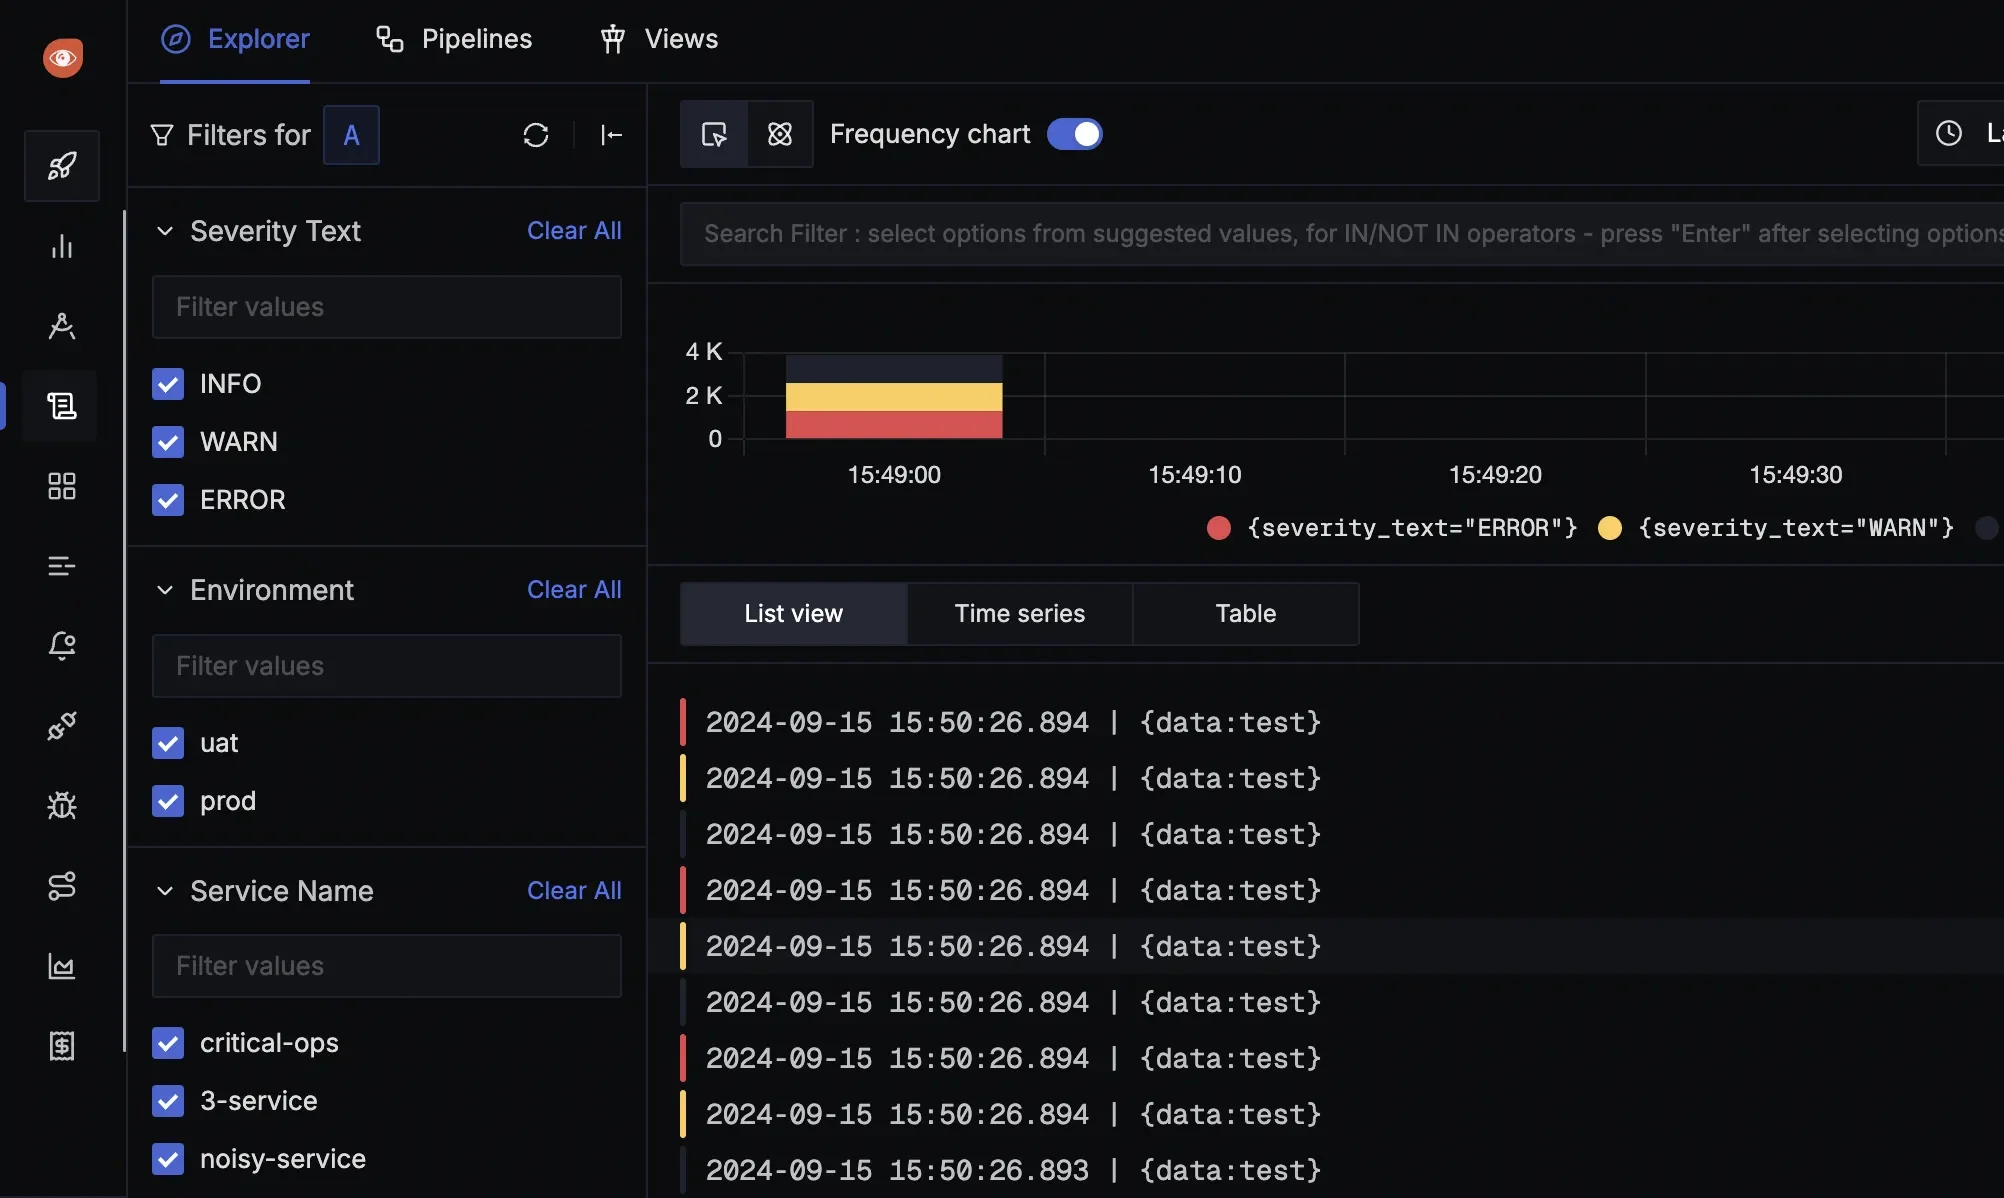
Users can now utilize quick filters to drill down into logs more efficiently. For example, filtering logs by attributes like service.name or severity (error, info, etc.) can now be done in just a few clicks. The new filtering experience allows users to reach the desired log data much faster without manually typing out complex queries.
Sync with Query Builder
The filters sync with the query builder including multiple queries to ensure that changes are applied to the relevant queries. For example, in the below product screenshot the user is editing Query B and the filter panel reflects filters for Query B.
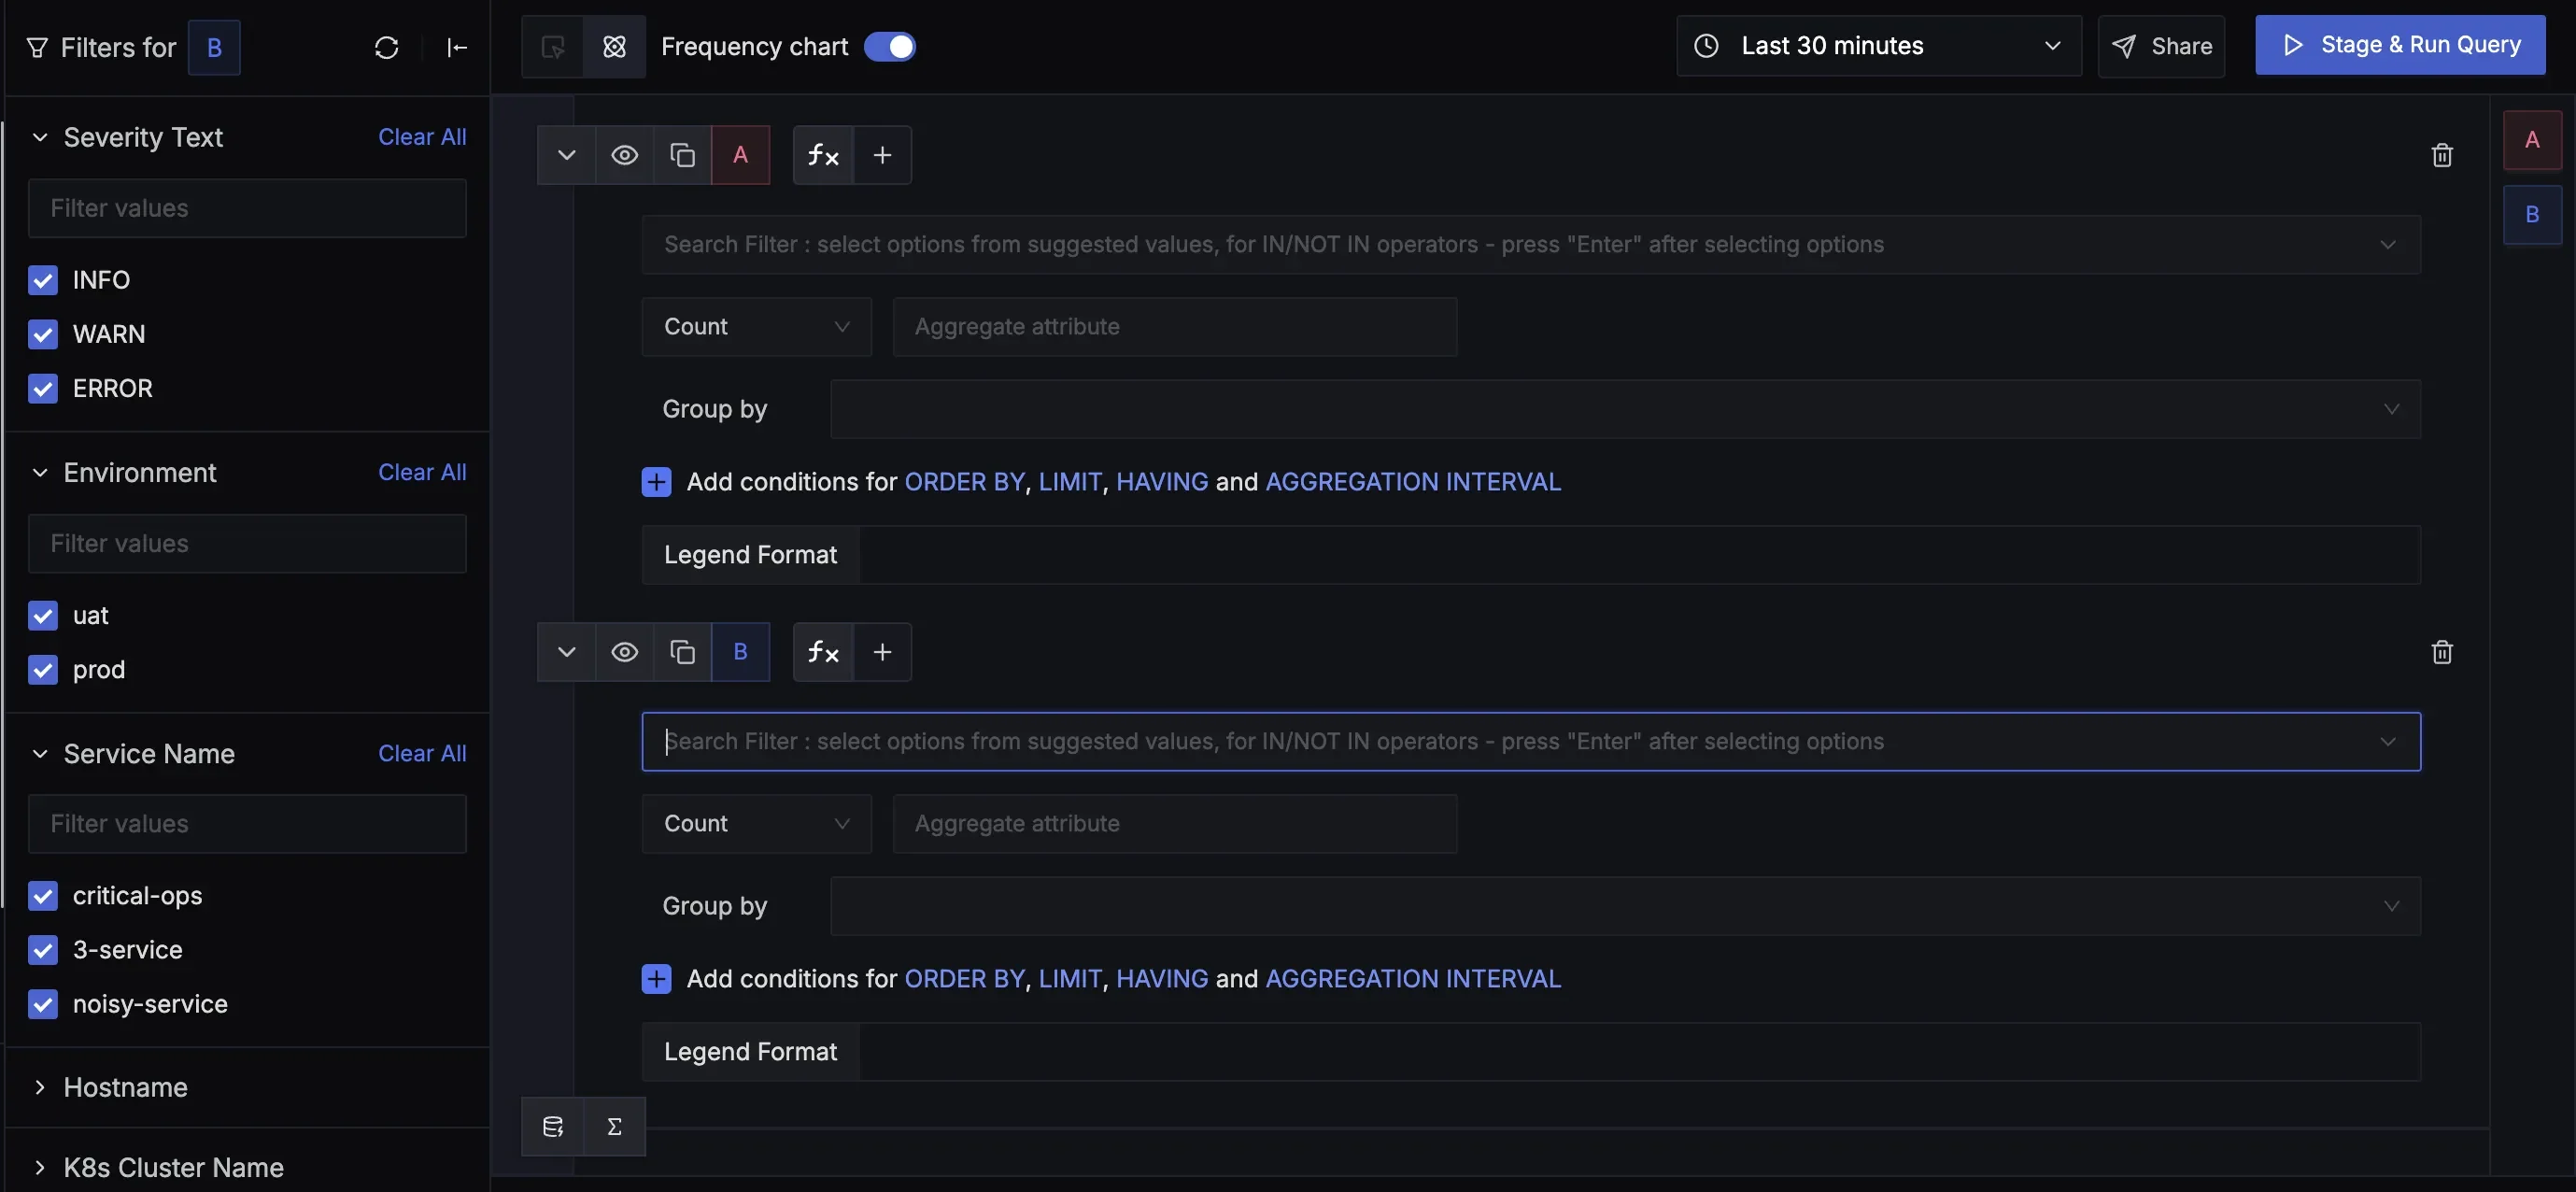
When you switch between different queries, the filter panel automatically adjusts to the selected query. This behavior helps users manage multiple log queries effectively, making filtering more intuitive.
Cancel Long-Running Queries
Users can now cancel long-running log queries, making it easier to modify search parameters without waiting for a slow query to finish. This feature is especially helpful when users realize mid-search that they have applied a large time frame or need to adjust filters.
Filter attributes that respect Opentelemetry hierarchy model
We’ve aligned our log attributes with the OpenTelemetry log model. Resource attributes (e.g., deployment.environment) are now highlighted in red, making them easy to identify. Standard attributes appear in white, and future support for tag attributes will use unique colors to differentiate them further. This categorization allows users to identify key information quickly.
Enhancements to Log Consumption
Customizable Font Sizes
Users can now adjust the font size in the log viewer. You can choose between small, medium, and large to view logs based on your preference.
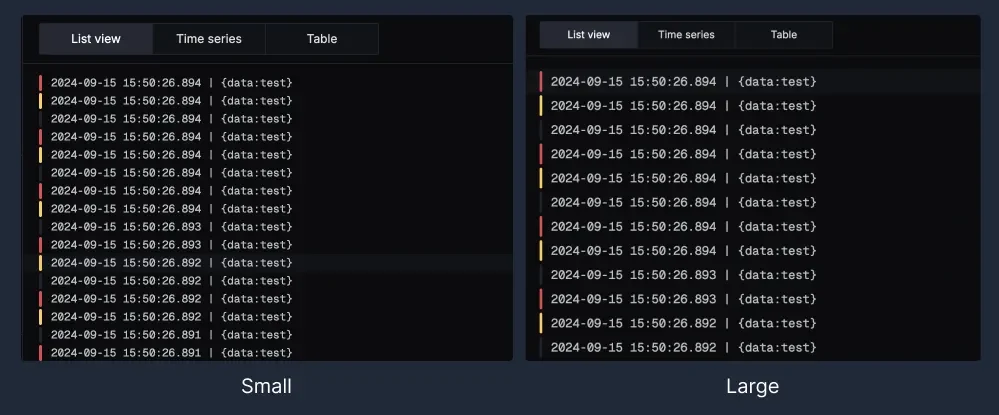
This flexibility allows for different viewing preferences—whether you prefer smaller fonts to view more logs on a single screen or larger fonts for easy readability.
Pinned Attributes in log details view
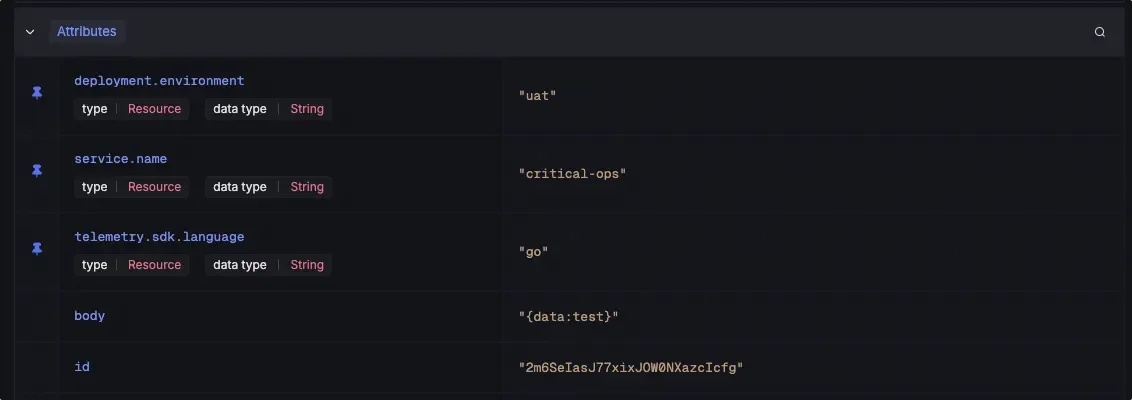
When users select key attributes (like deployment.environment or service.name) to be added in the column, these attributes are pinned to the top when navigating to the log details page. This ensures that the context remains intact, making it easier to dive deeper into specific log lines.
Grouping by Attributes

On the log details page, users can group log data by specific attributes (e.g., telemetry.sdk.language). You just need to click on Group By Attribute and you will be able to apply that attribute as a group by filter.

This helps visualize the distribution of log entries based on various criteria, giving more insights into the logs.
What’s Coming Next: Future Roadmap for Logs
We’re actively collecting feedback from our users on the next set of improvements that we can do for Logs in SigNoz. Some of the things that we have in mind are:
- Query Insights: We are working on adding a feature that provides insights into each log query, such as the number of rows scanned, the time taken for execution, and which filters are most effective. This will help users optimize their searches and improve performance by adjusting query parameters based on these insights.
- Log Patterns: Soon, you’ll be able to detect patterns within logs. If you have tens of thousands of log entries, grouping them into different patterns will allow you to identify common issues more efficiently. Additionally, the system will highlight logs that don’t fit any known pattern, signaling a potential anomaly.
- Correlation with Ingest Guard: This is at idea stage, and we would love to hear more from you. We think that linking log patterns to specific teams or ingestion keys, will allow platform teams to identify unnecessary logs (such as health check logs) that may be contributing to data volume. This will help teams optimize log ingestion and control costs.
Get Started with the New Logs Experience
We hope these enhancements take your log experience in SigNoz to the next level. We encourage you to try out the new features and share your feedback with us through our community Slack channel. Your insights help us continue to refine and build a better product for you.
With these improvements, we’re excited to see how teams will speed up their troubleshooting and gain deeper insights from their log data. More exciting updates are on the horizon, so stay tuned!
And that’s it for SigNoz Launch Week 2.0
And that’s a wrap on SigNoz Launch Week 2.0. We had fun building, shipping and finally showcasing all the features to our users. Hope you enjoyed it. Let us know how you like these features and suggest areas of improvement.
Check out all features launched in this launch week.

