Cloud Load Balancer Metrics
Overview
This document provides a detailed walkthrough on how to send Google Cloud Load Balancer metrics to SigNoz. By the end of this guide, you will have a setup that sends your Cloud Load Balancer metrics to SigNoz.
Here's a quick summary of what we will be doing in this guide
- Deploy Telegraf to fetch the metrics from Google Cloud monitoring.
- Deploy OpenTelemetry to scrape the metrics from Telegraf.
- Send and Visualize the metrics obtained by OpenTelemetry in SigNoz
Prerequisites
- You should have a Google Cloud account with administrative privileges or Cloud Load Balancer Admin privileges both should suffice.
- Cloud Load Balancer
- A SigNoz Cloud account. You'll need the ingestion details. To obtain your Ingestion Key and URL, log in to your SigNoz Cloud account and navigate to Settings >> Ingestion Settings.
- Access to a project in Google Cloud Platform (GCP).
- The Google Cloud Load Balancer APIs must be enabled. You can follow this guide to learn how to enable an API in Google Cloud.
Setup
Deploy Telegraf to fetch the metrics from Google Cloud Monitoring.
Step 1: Install telegraf, which will collect metrics from Google Cloud Monitoring for Cloud Load Balancer, see the available metrics for load balancer. The installation process for the respective operating system can be found in official documentation.
After successful installation, the telegraf status should be active and running.

Running telegraf
The configuration file for telegraf can be found here:
/etc/telegraf/telegraf.conf
Step 2: Configure the Telegraf input and output plugin by adding configurations to the telegraf.conf file.
Gather timeseries from Google Cloud Platform v3 monitoring API
[[inputs.stackdriver]]

  ## GCP Project

  project = "omni-new"

  ## Include timeseries that start with the given metric type.

  metric_type_prefix_include = [

    "loadbalancing.googleapis.com",

  ]

  ## Most metrics are updated no more than once per minute; it is recommended

  ## to override the agent level interval with a 1m or greater value.

  interval = "1m"

# Send OpenTelemetry metrics over gRPC

[[outputs.opentelemetry]]

  ## Override the default (localhost:4317) OpenTelemetry gRPC service

  ## address:port

  service_address = "localhost:4317"
Deploy OpenTelemetry to scrape the metrics from Telegraf
Step 1: Install and configure OpenTelemetry for scraping the metrics from Telegraf. Follow OpenTelemetry Binary Usage in Virtual Machine guide for detailed instructions.
Step 2: After successful configuration, start the OTel Collector using the following command:
./otelcol-contrib --config ./config.yaml &> otelcol-output.log & echo "$!" > otel-pid
Step 3: Restart the Telegraf service
sudo service telegraf restart
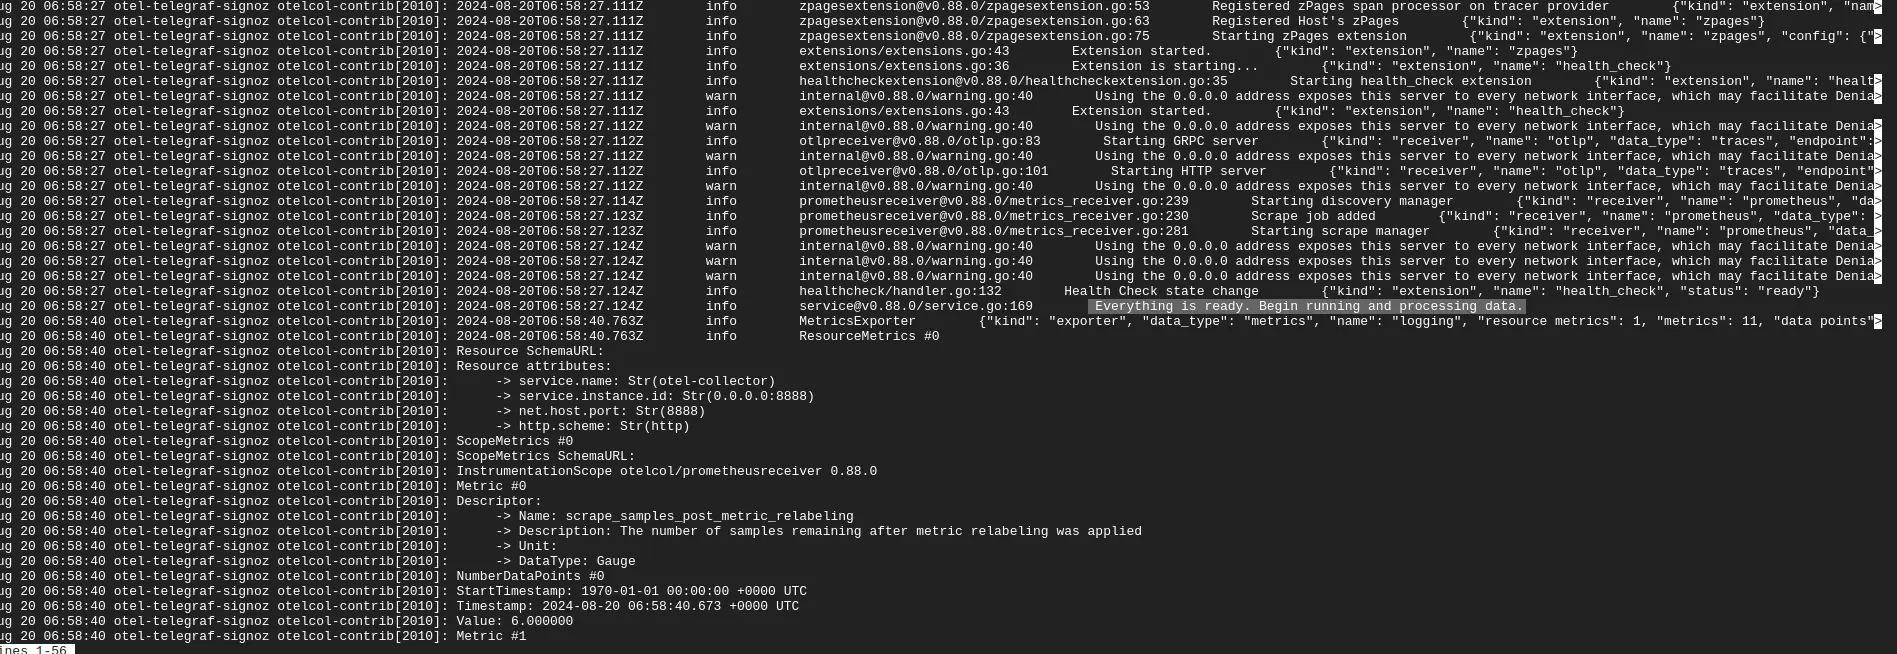
Step 4: If the configurations are configured correctly with Telegraf we can see the output logs from OpenTelemtery as follows:

OpenTelemetry logs
Send and Visualize the metrics obtained by OpenTelemetry in SigNoz
Step 1: Go to the SigNoz Cloud URL and head over to the dashboard.
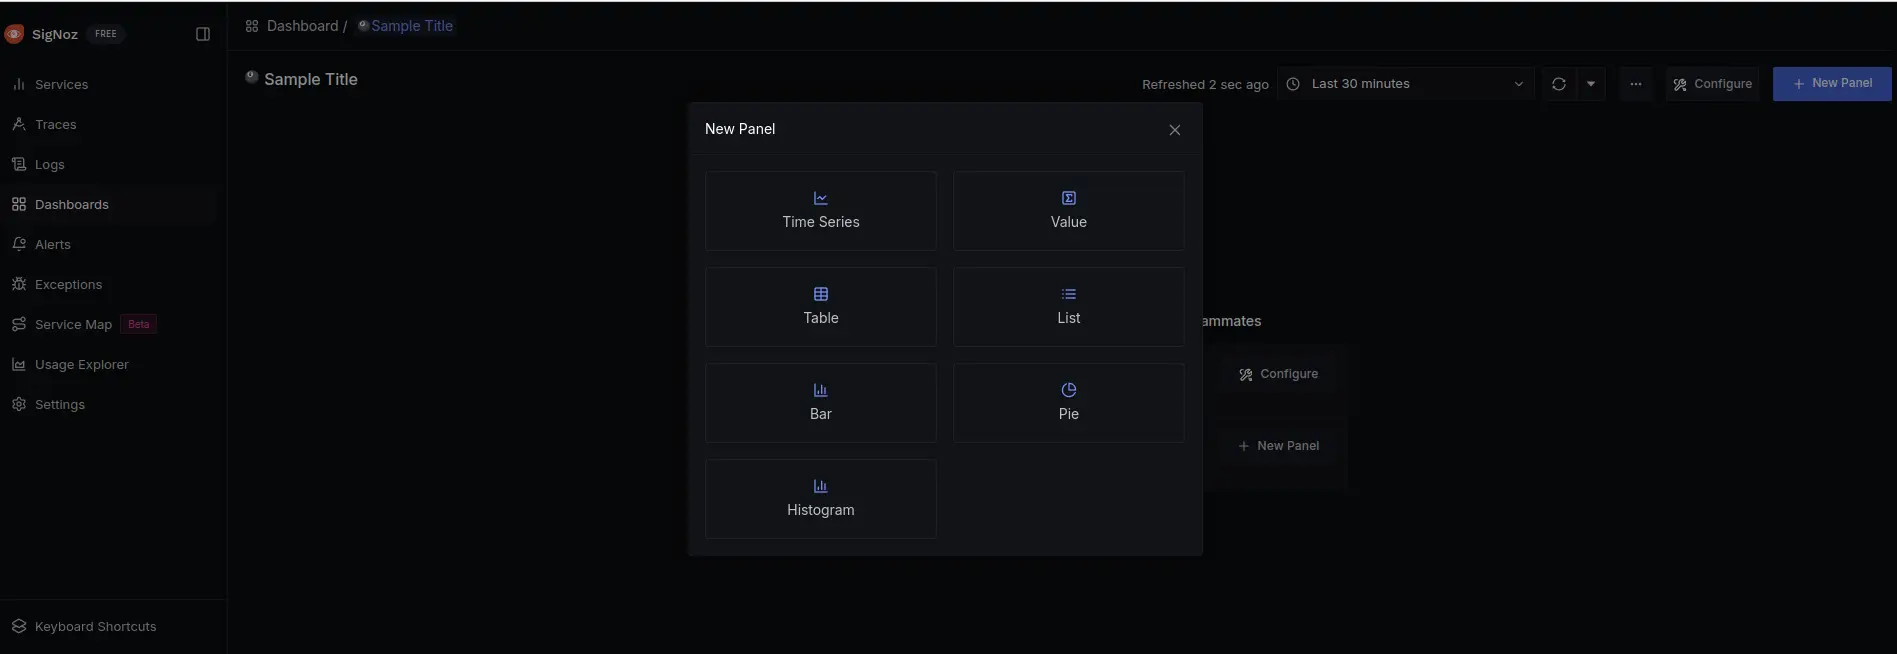
Step 2: If not already created, create a new dashboard and select Time Series.

Create dashboard in SigNoz
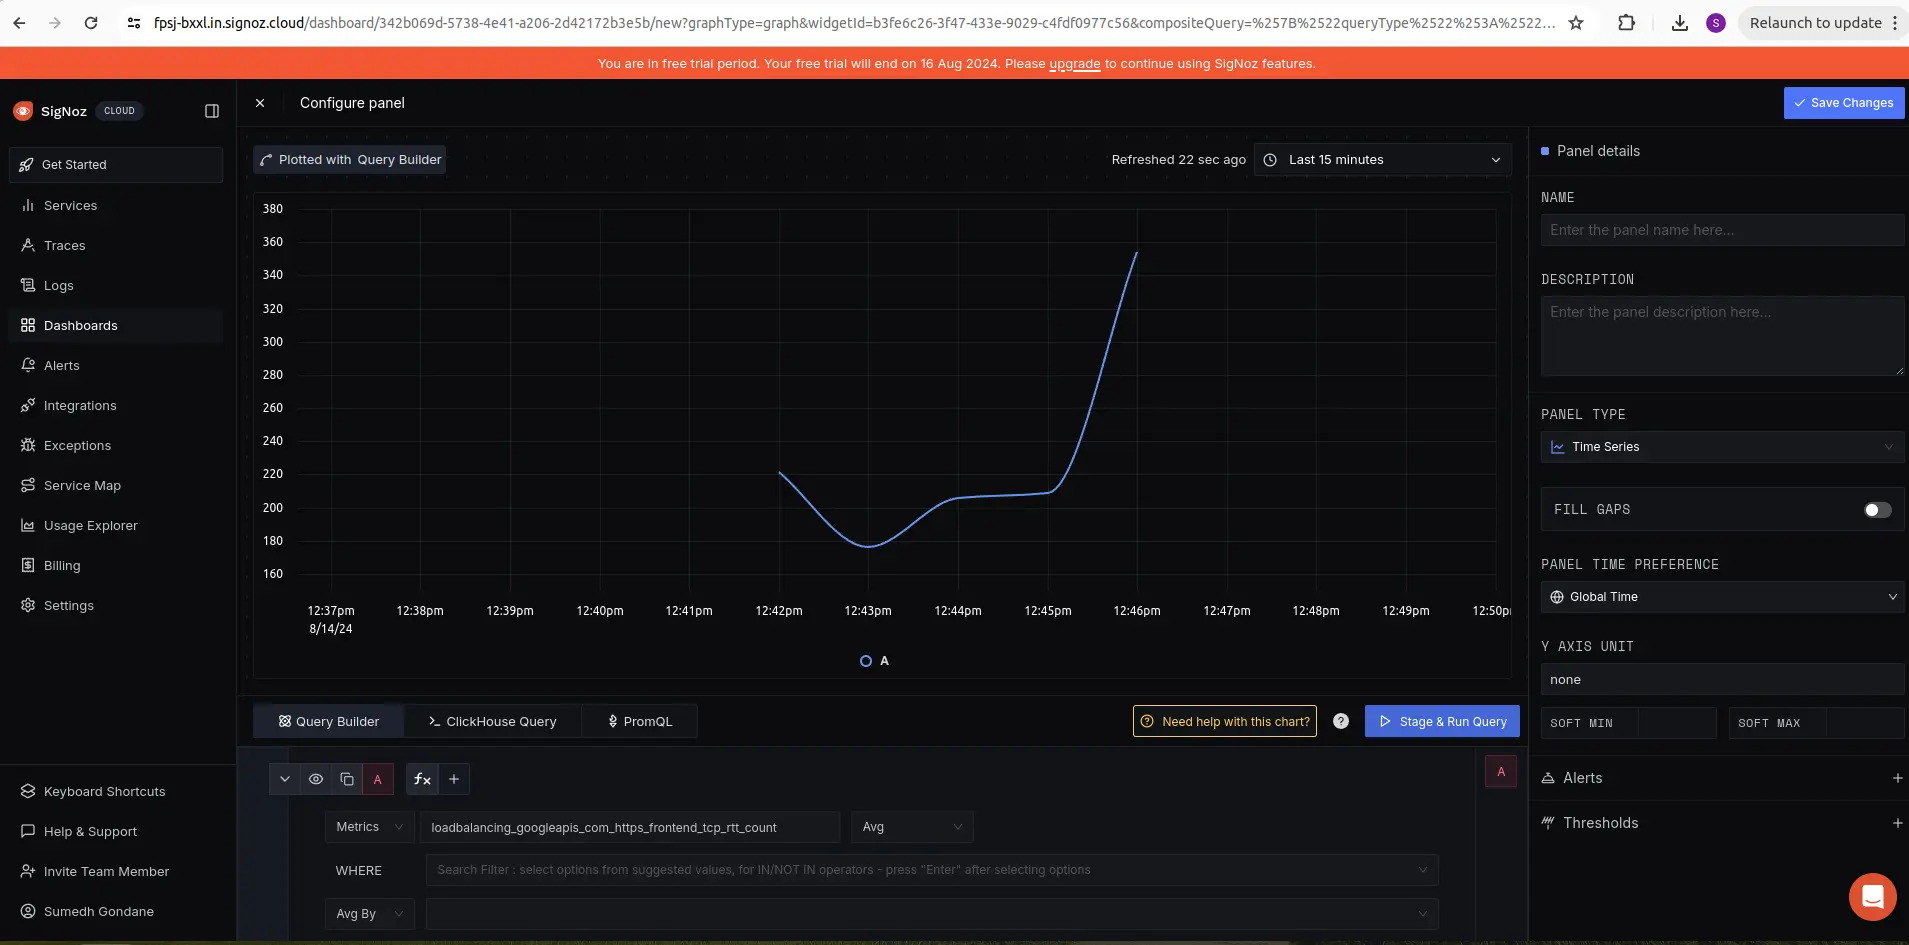
Step 3: Select the metric for the cloud load balancer.
For example loadbalancing_googleapis_com_https_frontend_tcp_rtt_count is one of the metrics that was collected.

Detailed view of the selected metric
Troubleshooting
If you run into any problems while setting up monitoring for your Cloud Load Balancer metrics with SigNoz, consider these troubleshooting steps:
- Verify Configuration: Double-check your
config.yamlfile to ensure all settings, including the ingestion key and endpoint, are correct. - Review Logs: Look at the logs of your Cloud Load Balancer and the OpenTelemetry Collector to identify any error messages or warnings that might provide insights into what’s going wrong.
- Consult Documentation: Review the SigNoz, OpenTelemetry, and Telegraf documentation for additional troubleshooting of the common issues.
